×
×
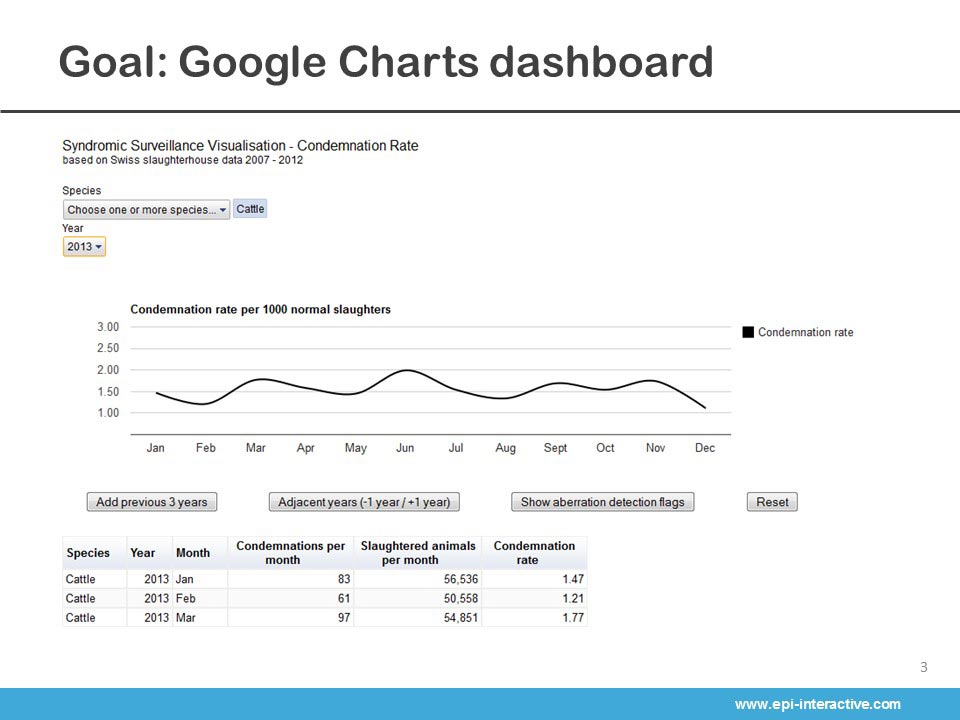
I was tasked by Epi-interactive to develop a basic web application to help teach people basic data visualisation tools at Science Week in Australia. Some technologies used were:
- R
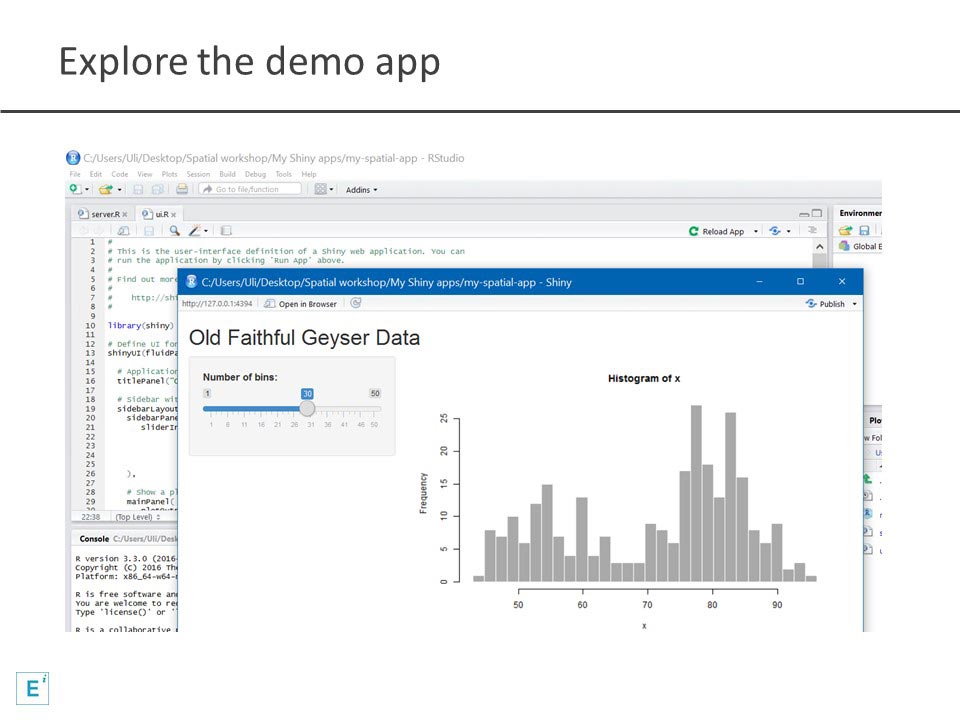
- Shiny Server
- Google fusion tables
- Google charts
- Google Maps
- Leaflet
- MapQuest Geocoding API
Using this web application I broke it down into stages and wrote documentation for a future presentation.