×
×
×
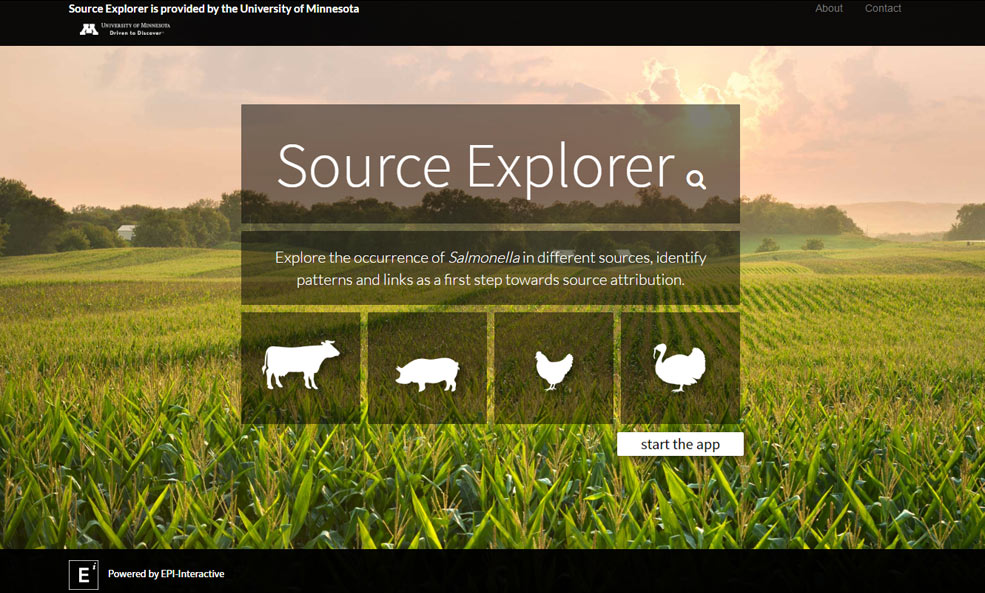
I was tasked by Epi-interactive to contribute to this project for the University of Minnesota. It aimed to create a set of visualisation tools “for a multi-source Salmonella dataset to investigate the contribution of different sources to the burden of human disease”. This project is built using Shiny and R.
My contributions to the project were:
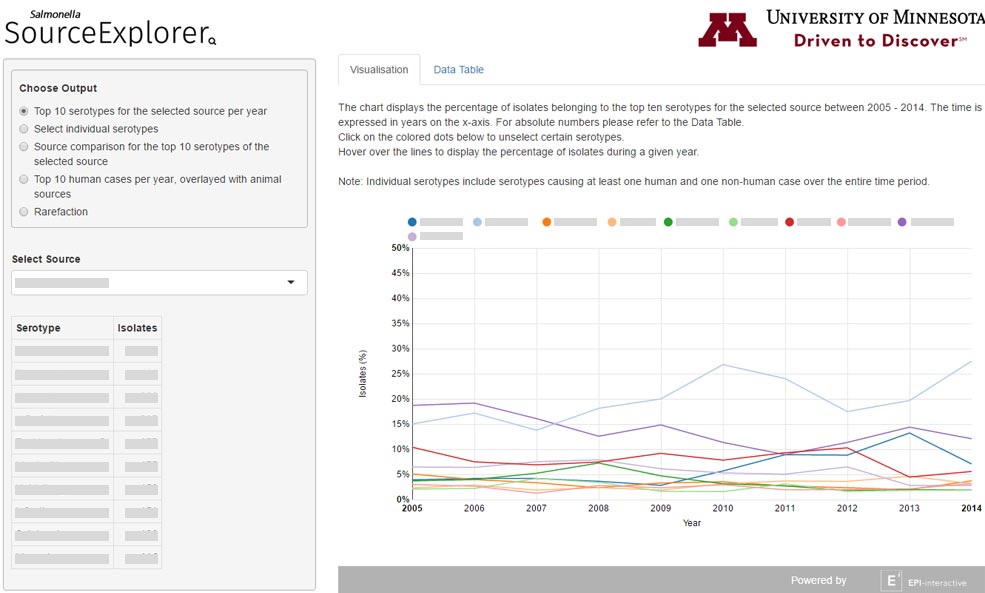
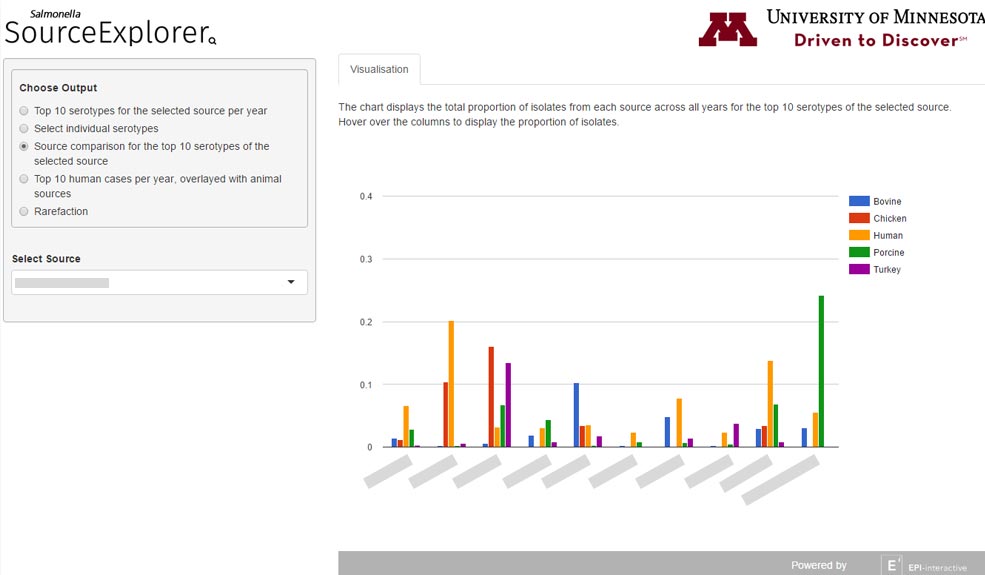
- Creating responsive user interface from mock ups
- Full rewrite of the data loading code and removal of hard coded strings to better handle changes to the datasets.
- Addition of Google Chart visualisations
- Numerous bug fixes and visual tweaks